Project Resurrection
A recent change in my day to day work activities has once again brought forth the need to track my hours. The last time I was in a similar situation was over ten years ago, where my employer at the time would pay a different tax rate depending on the type of work that was being done.
To easily keep track of what I was working on then I wrote a small tool, in my spare time, that let me press a keybinding, type what I was working on, and hit enter to save the state. Like this:
The tool was used by myself and a few of my colleagues, at which point I guess I had the idea that it might be a useful service, and proceeded to over-engineer the crap out of it:
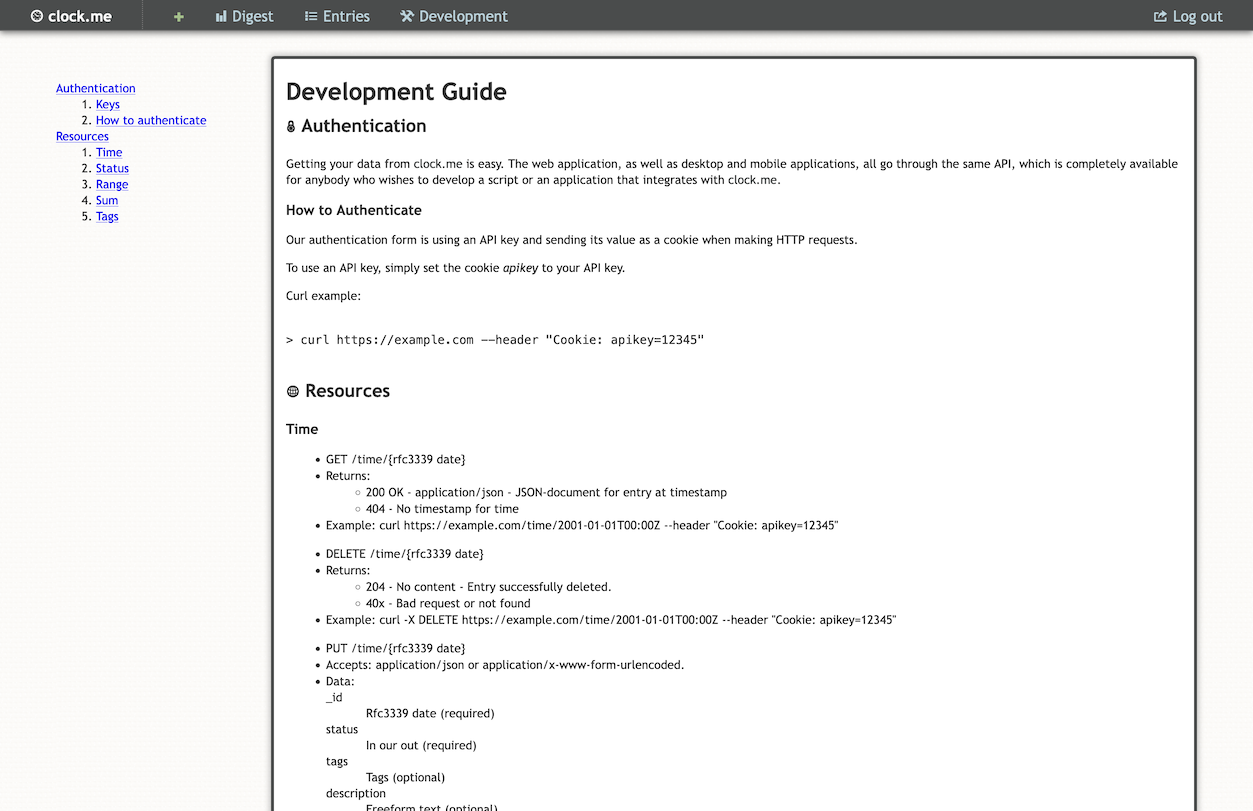
- Added a web service, with a REST API and OAuth authentication.
- Stored a user's time entries in couchdb.
- Designed a dashboard, with some charts and table visualizations.
- Added way too many features to the desktop application.
- A phone app
At some point I had dug myself down a deep enough rabbit-hole that I got stuck, life/work circumstances changed and project development stalled. I did maintain the service for quite a few years, as it was used by friends and colleagues, but at some point it was no longer needed and I decomissioned the server and added the remaining code to my big pile of unfinished programming projects.
When the need to track my hours recently resurfaced, I started doing so using org-mode in emacs, and eventually toggl. Still, I had fond memories of the old tool, not the overengineered crap field of rabbit holes mind you, but the original version, with its simplicity and ease-of-use. It would be nice to pop it from the pile of perpetual projects; polish and publish it!
Does it compile?
Nope.
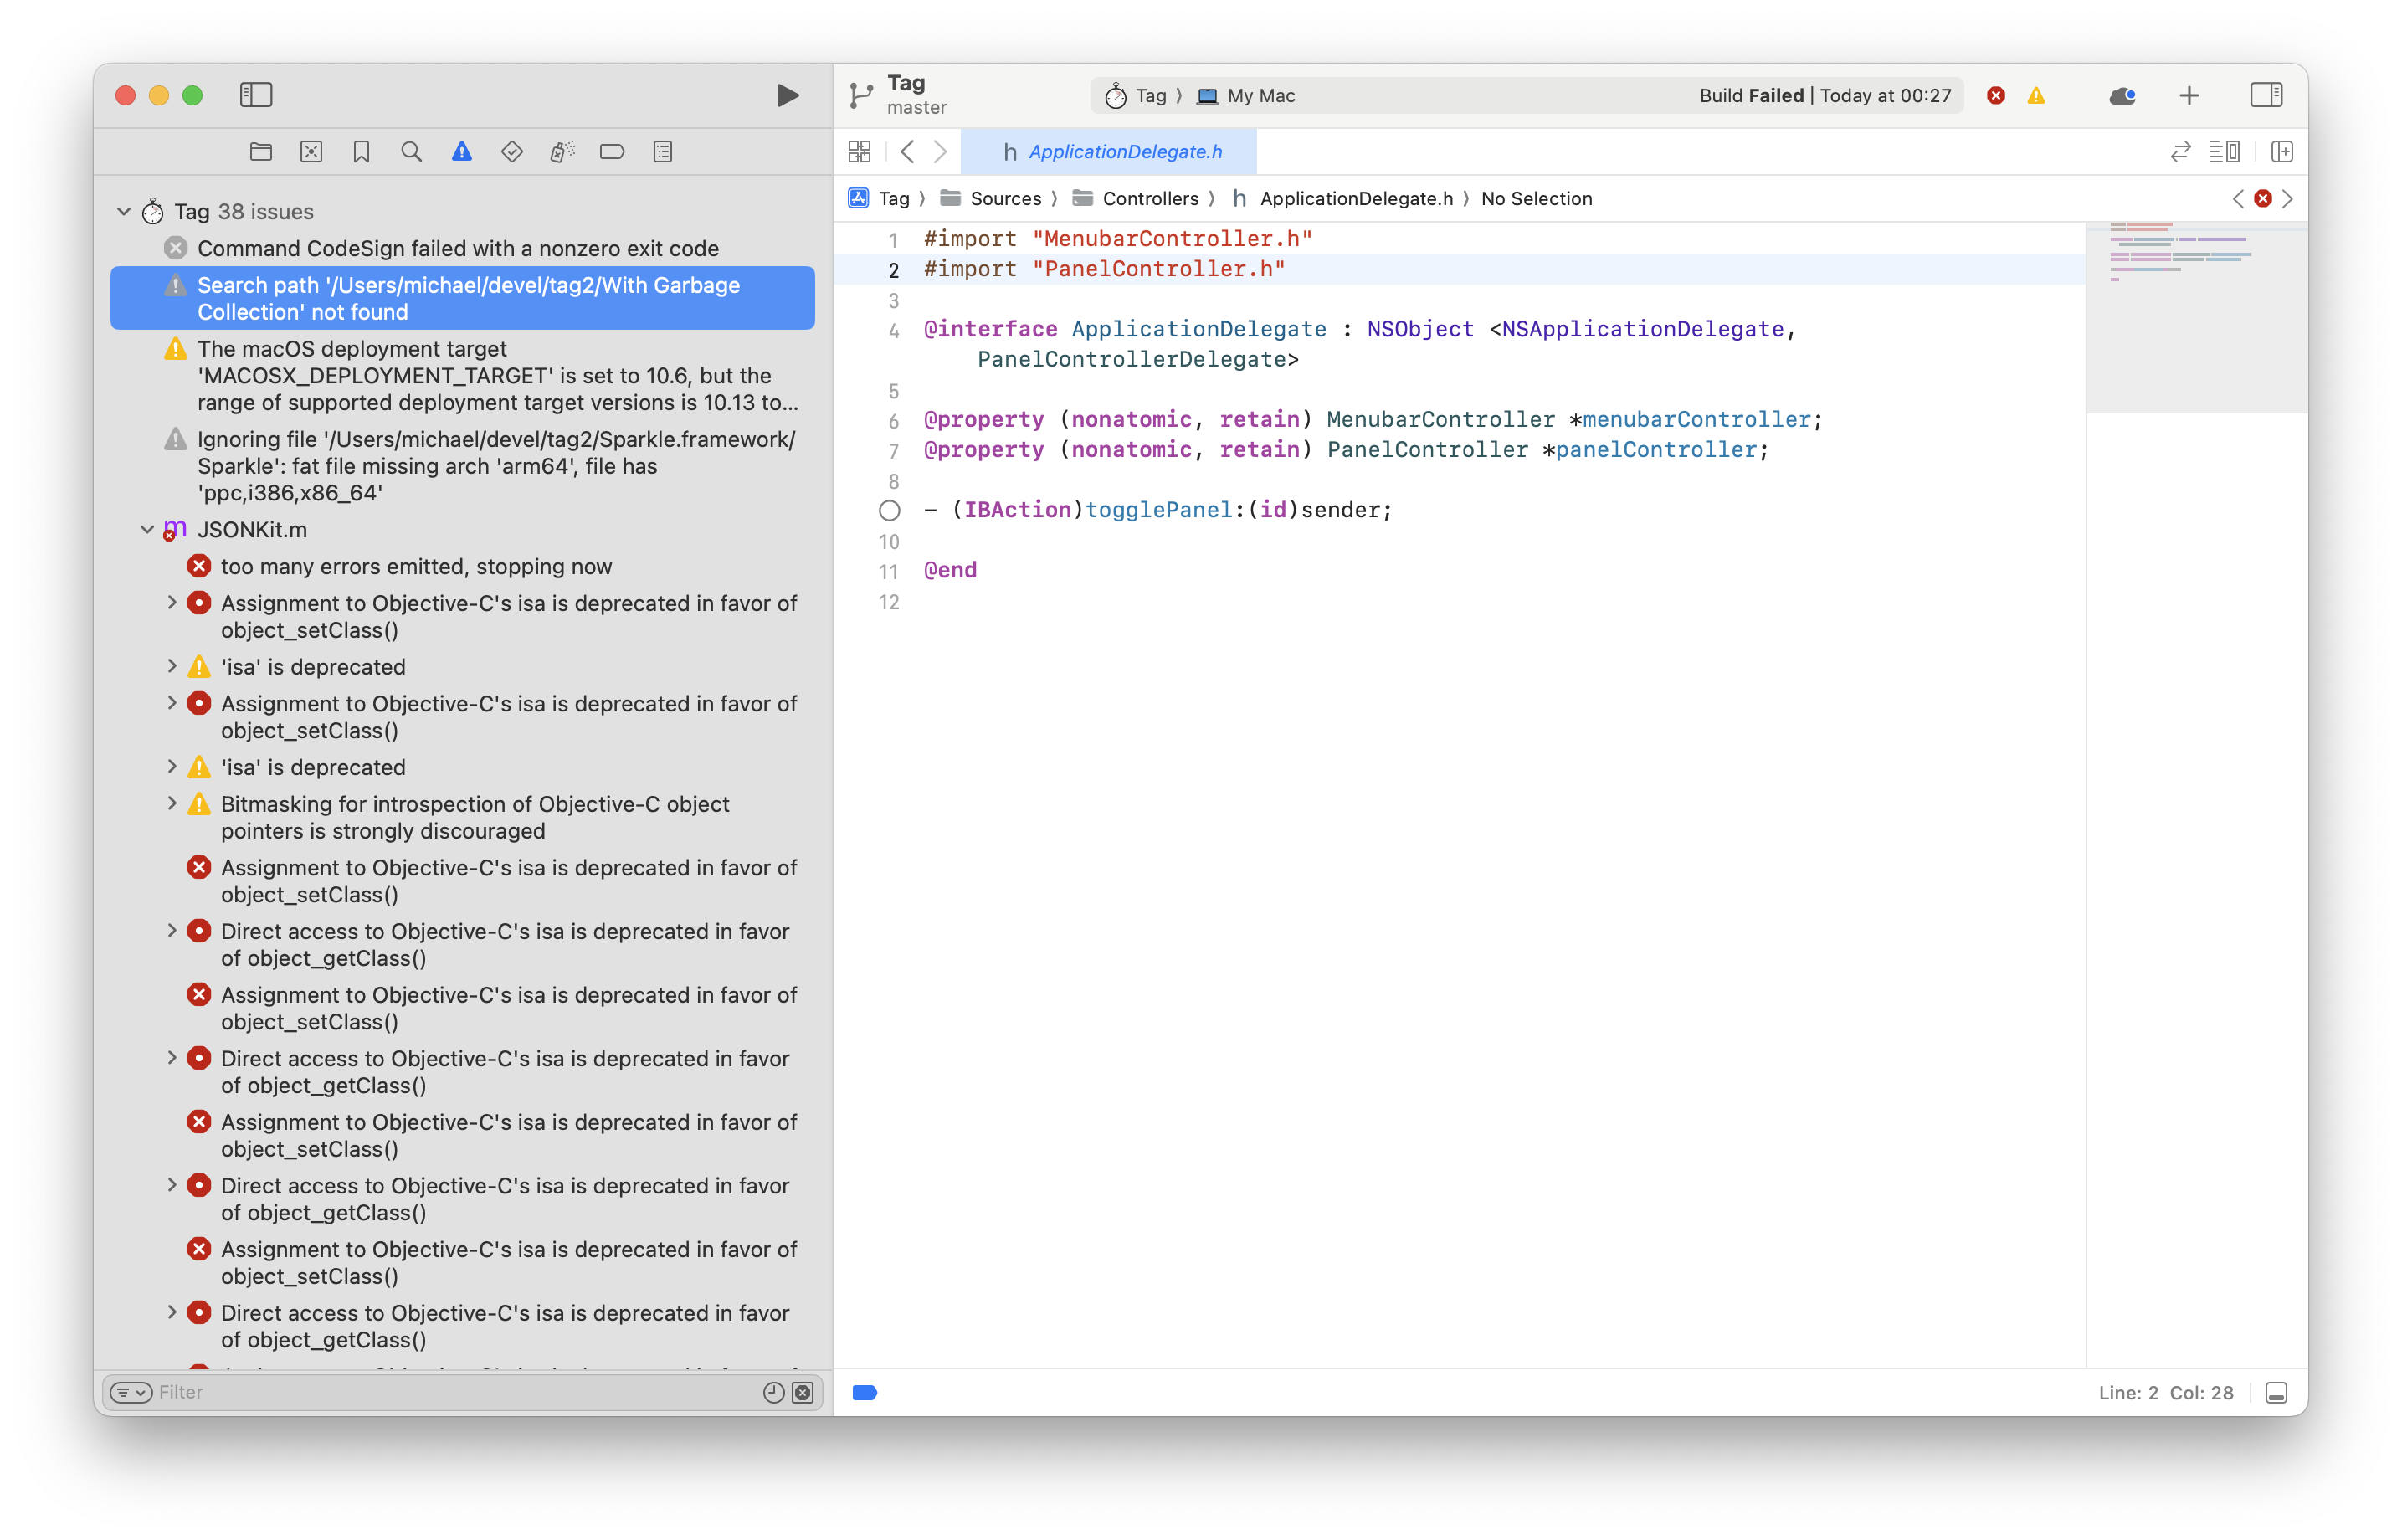
The compile errors were luckily easy to fix by removing/updating/replacing external dependencies, rewriting code using deprecated APIs, and targetting a platform that hasn't been EOL'd.
Does it run?
Nope.
Well, it does launch, but gets stuck waiting for a HTTP response almost immediately. The code, which was left in an unfinished state, is essentially an application built upon an unfinished REST API. It's tighly coupled with an online service, and will not work offline.
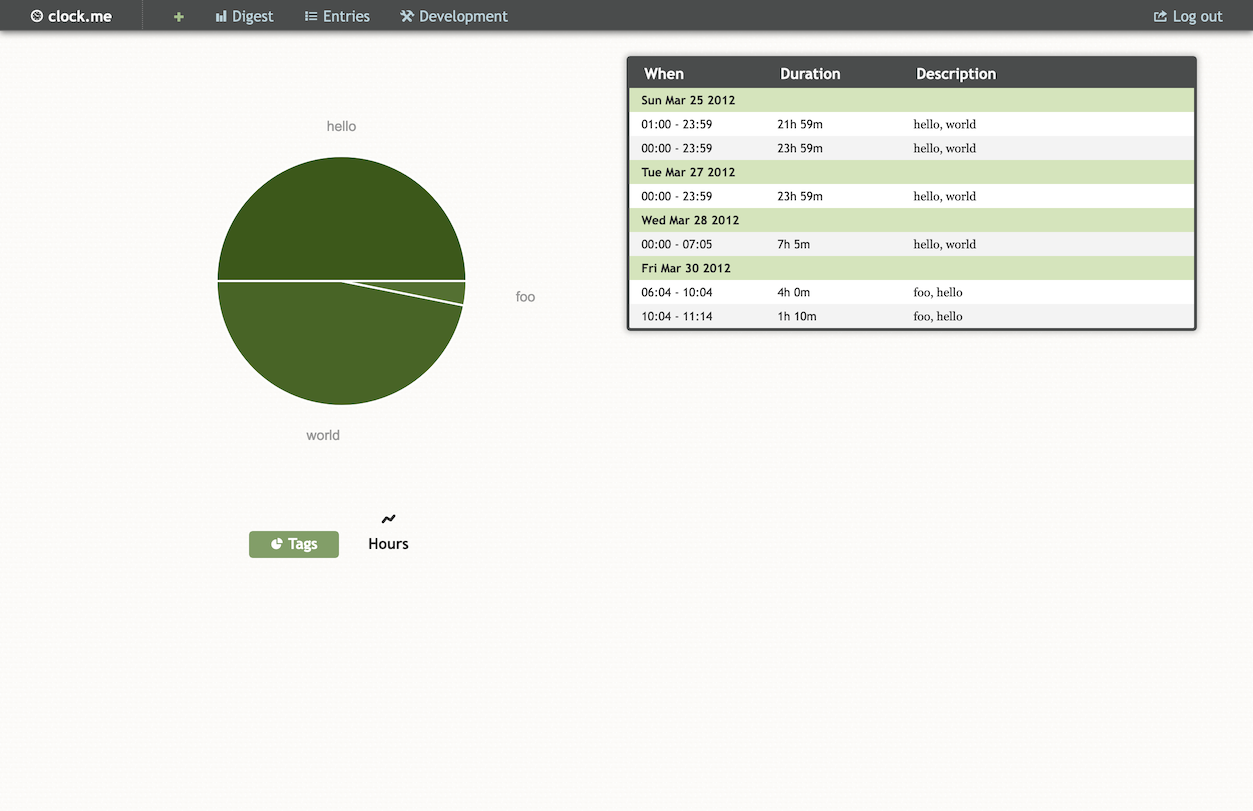
An early version of the online service running locally. Mock user data extracted from unit tests
Plugging rabbit holes
Having since learned that complexity is the enemy, and avoiding the sunken costs fallacy, we'll start by throwing out everything we no longer need:
- Web server ⮕ 🗑️
- Unfinished phone app ⮕ 🗑️
- Desktop app features for manipulating past entries ⮕ 🗑️
That leaves us with a greatly reduced code base, and a new set of goals:
- Works offline.
- Stores hours in a CSV file, no web server, edits can be done by fixing the CSV file.
- Reports are generated from the CSV file.
CSV Store format
I replaced all the client side REST code with a simple storage class that reads/writes to a CSV file. The format is:
UTC start, UTC stop, tags, description
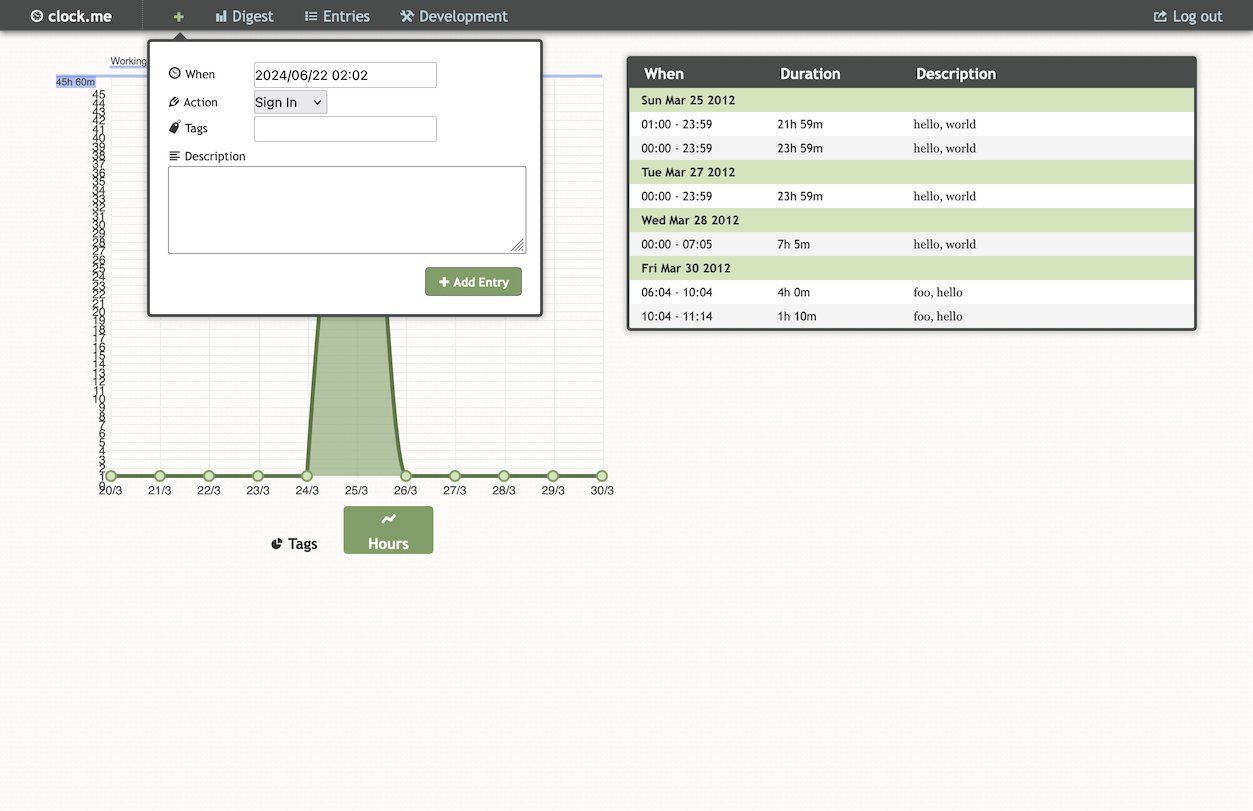
Each start timestamp must be greater than or equal to the previous stop timestamp. The last line can leave the stop timestamp blank to indicate an ongoing task, when the UI is used to complete or change a task, the stop is written. Demo:
Note that the timestamps entered in the UI are based on the system timezone (CEST, UTC+02) they are only stored as UTC in the CSV file.
Reports
The original reports were rendered in the browser, using tables and svg, in this version we'll generate a static stand-alone HTML file from the CSV data.
First we split the data, so no entries overlap multiple days, and build a vec of type:
#[derive(Debug, Deserialize)]
struct Record {
    start: String,
    end: String,
    tags: String,
    description: String,
}
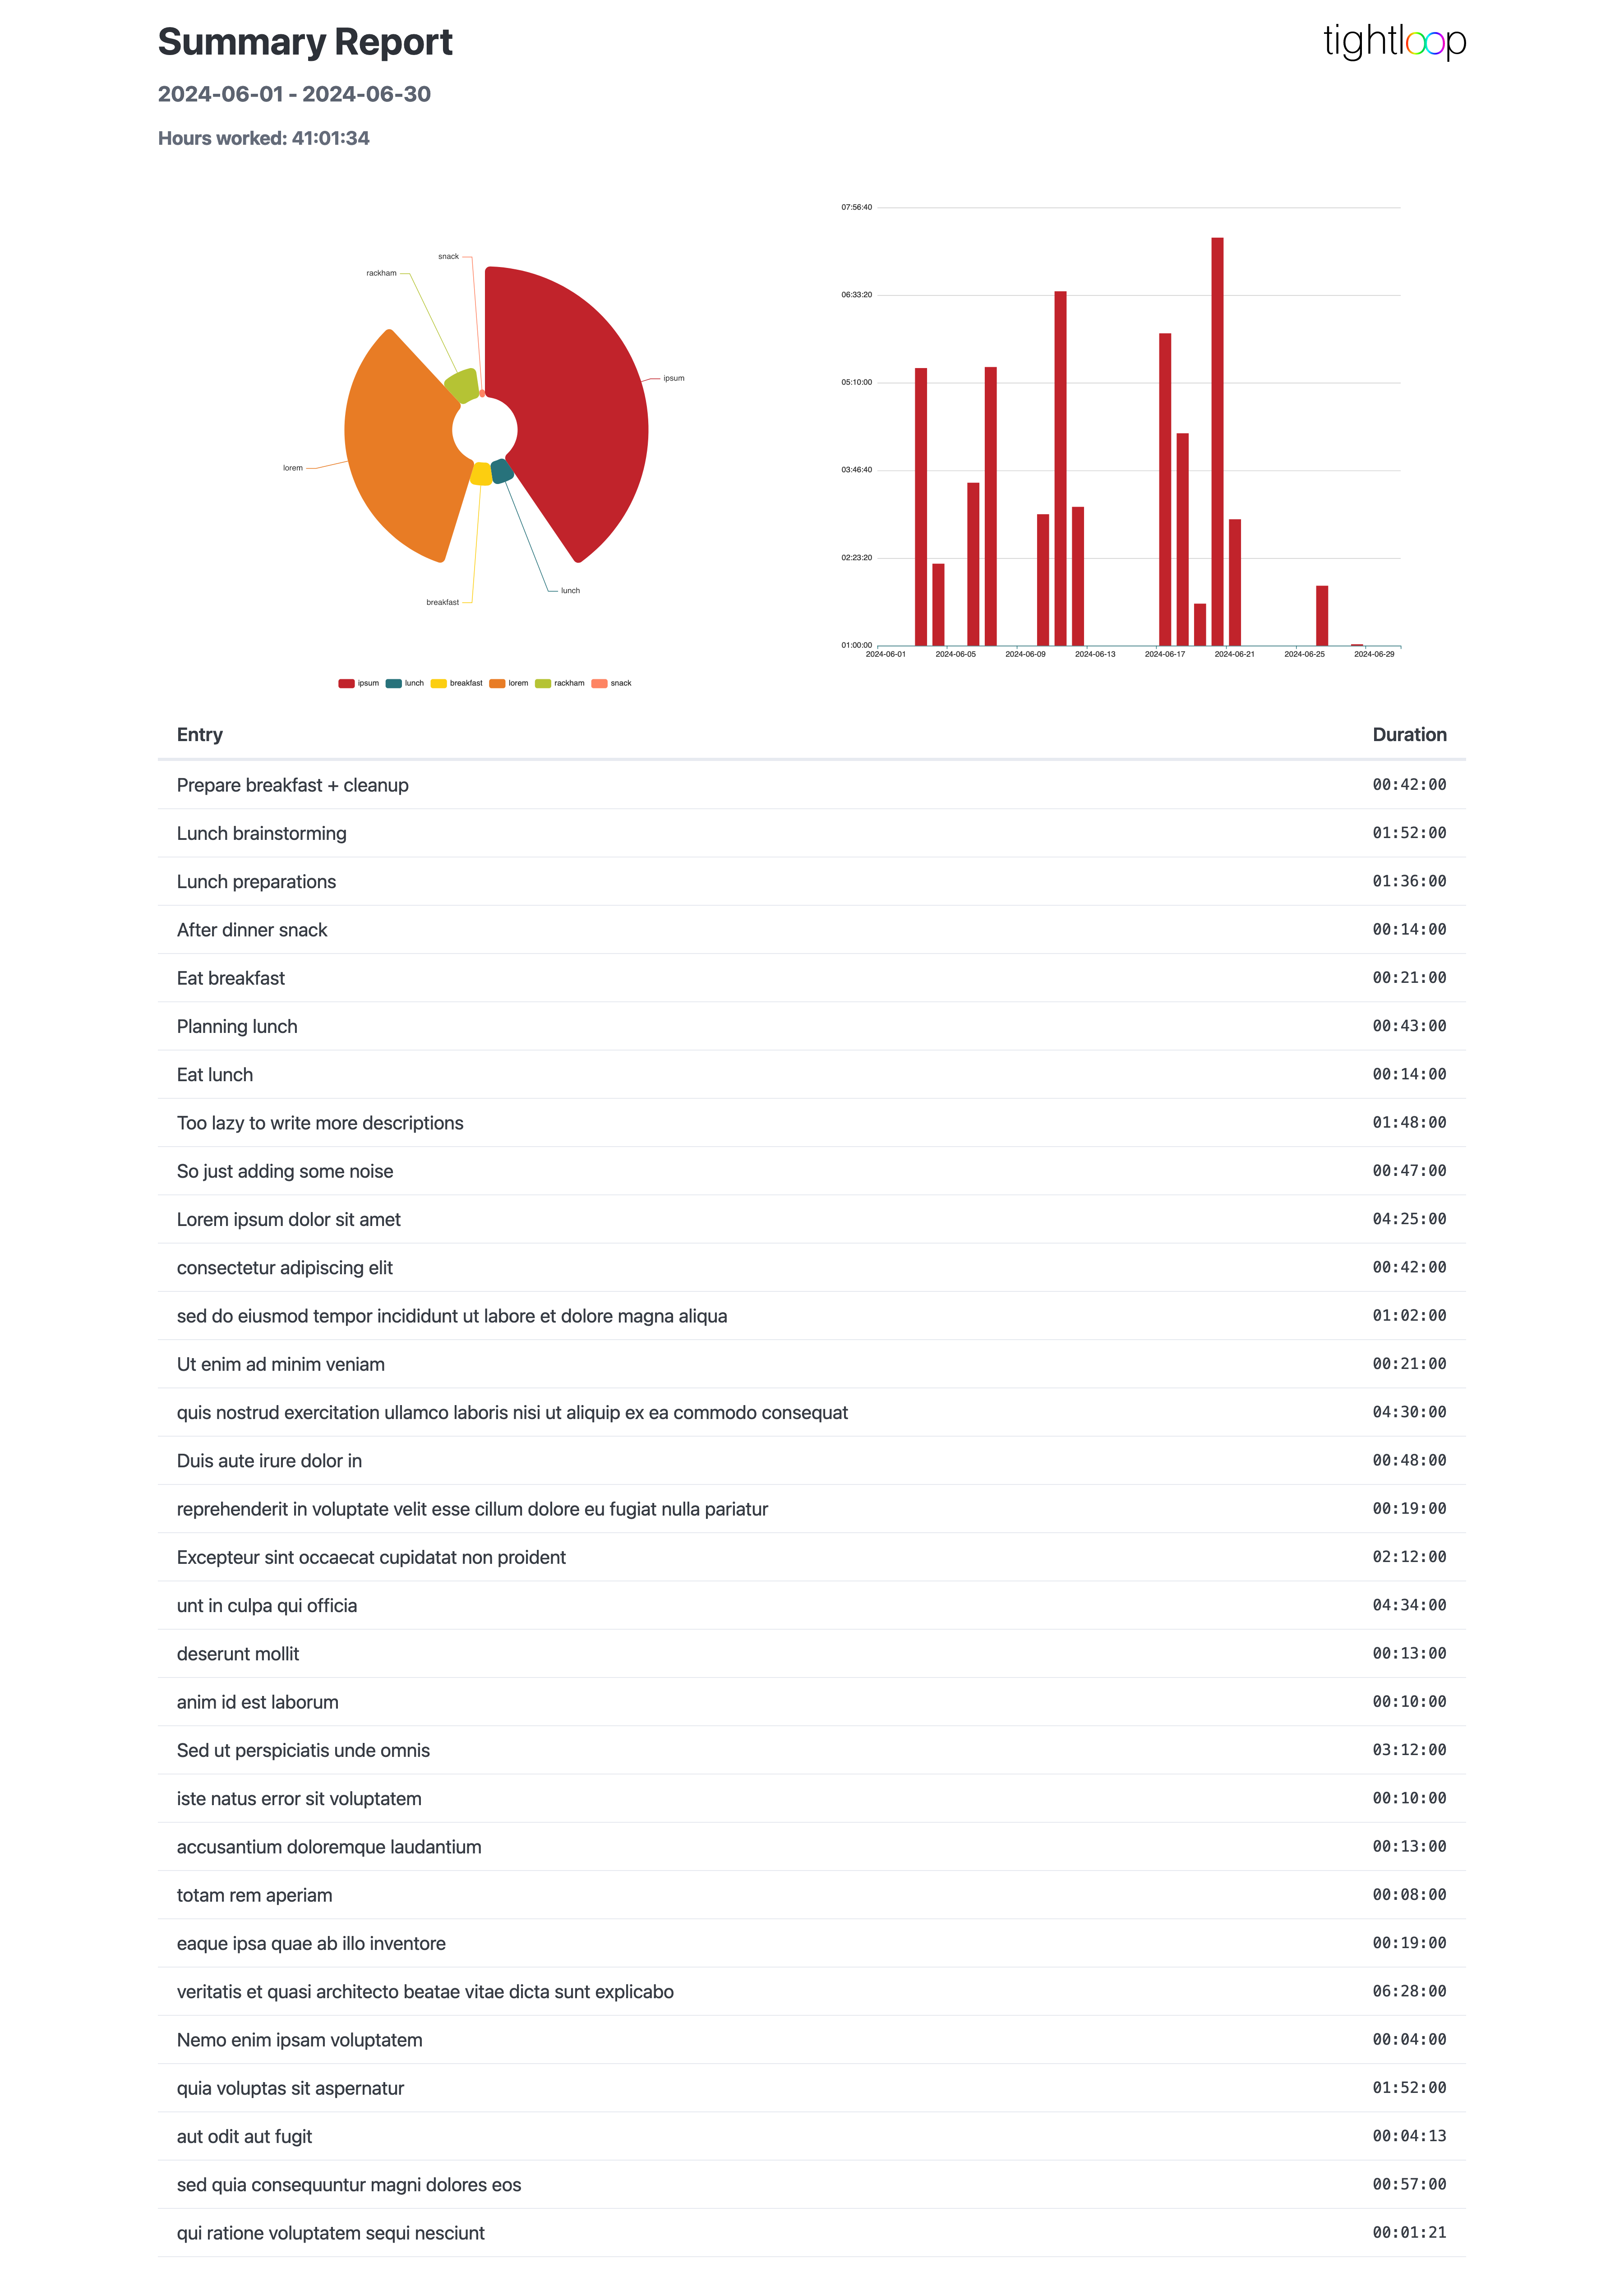
And using Charming we can generate a nice pie chart based on tags:
pub fn pie(data: Vec<&String>) -> String {
    let chart = Chart::new().legend(Legend::new().top("bottom")).series(
        Pie::new()
            .name("Tags")
            .rose_type(PieRoseType::Radius)
            .radius(vec!["50", "250"])
            .center(vec!["50%", "50%"])
            .item_style(ItemStyle::new().border_radius(8))
            .data(count(data)),
    );

    let mut renderer = ImageRenderer::new(1000, 800).theme(Theme::Infographic);
    renderer.render(&chart).unwrap()
}

...

let tags = entries.iter().flat_map(|entry| &entry.2).collect();
let pie_chart = pie(tags);
And a bar chart over hours per day
pub fn bar(data: Vec<(i64, i64)>, start_date: DateTime<Tz>, end_date: DateTime<Tz>) -> String {
    let map = data.iter().into_group_map_by(|e| {
        DateTime::from_timestamp(e.0, 0)
            .unwrap()
            .with_timezone(&start_date.timezone())
            .date_naive()
    });

    let zipped = DateRange(start_date.date_naive(), end_date.date_naive()).map(|date| {
        match map
            .get(&date)
            .map(|vec| vec.iter().map(|x| x.1 - x.0).sum::<i64>())
            .map(|sum| (date.to_string(), sum))
        {
            Some(tuple) => tuple,
            None => (date.to_string(), 0),
        }
    });

    let (labels, values) = zipped.into_iter().unzip();

    let chart = Chart::new()
        .x_axis(Axis::new().type_(AxisType::Category).data(labels))
        .y_axis(
            Axis::new().type_(AxisType::Value).axis_label(
                AxisLabel::new().formatter(Formatter::Function(
                    r#"function (param) {
                        return new Date(param*1000).toLocaleTimeString('en-GB');
                    }"#
                    .into(),
                )),
            ),
        )
        .series(Bar::new().data(values));
    let mut renderer = ImageRenderer::new(1000, 800).theme(Theme::Infographic);
    renderer.render(&chart).unwrap()
}

...
let bar = bar(
    entries.iter().map(|entry| (entry.0, entry.1)).collect(),
    start.with_timezone(&timezone),
    end.with_timezone(&timezone),
);
Using a compile time mustache template and bart, we can render this to a standalone report. Screenshot:
Terminal debugging
While prototyping SVG generation, I found it tedious to generate a SVG file and open it in an image viewer, so I wrote a small terminal utility: svg2sixel. If your terminal supports sixels, like VSCode does, it will work something like this: