GIS Quest - Part III
In Part I and Part II most work was done in two dimensions. This part, the aptly named Part III, will be dedicated to a third dimension, altitude.
Elevation profiles
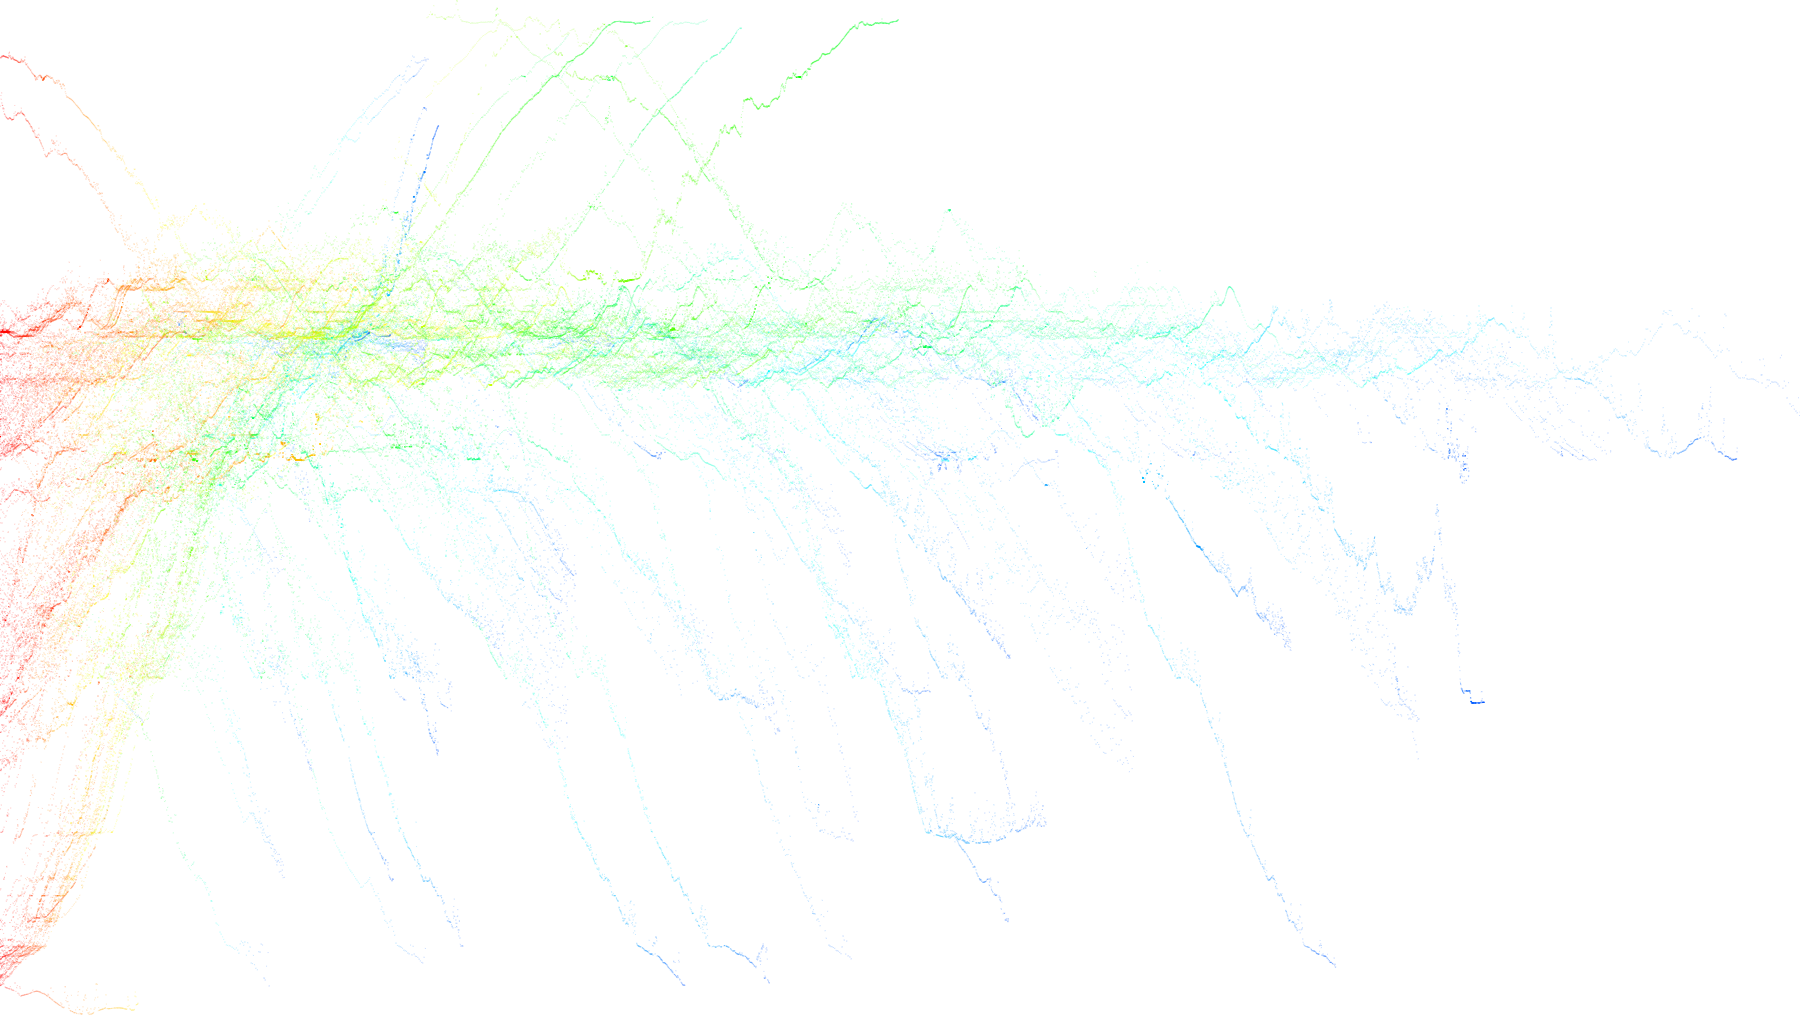
Plotting all the altitude data in the normalized and filtered geojson data from Part I, where the x-axis is distance and y-axis altitude, we get this interesting looking plot:

It seems the recorded GPS coordinate data is fairly coarse, and is updated in discrete steps.
Laser measurements
The Norwegian Mapping Authority offers high resolution (1m) digital terrain elevation data covering all of Norway. The data can be requested via the Høydedata service, and for Bergen it totals around 32GB.
The data I received was encoded using GeoTiff, using the universal transverse mercator (UTM) coordinate system, so to work with it I wrote a small Rust program, using GDAL, to translate from longitude/lattitude to UTM and fetch the altitude for a given point:
use utm::to_utm_wgs84;
use gdal::Dataset;

fn main() {
    let ds = Dataset::open(&args.filename).unwrap();
    let band = ds.rasterband(1).unwrap();

    let transform = ds.geo_transform().unwrap();
    let inv_transform = transform.invert().unwrap();

    let zone = 33; // Zone was extracted from the dataset metadata
    let (north, east, _) = to_utm_wgs84(lat, lng, zone);
    let (tx, ty) = inv_transform.apply(east, north);
    let buf = band.read_as::<f64>((tx as isize, ty as isize), (1, 1), (1,1), None).unwrap();
    println!("{},{},{}", lng, lat, buf.data[0]);
}
Fetching the altitude for the GPS coordinates, instead of using the recorded altitude from the GPS, gives this plot:
which has the same structure as the original plot, but removes some measuring innaccuracies and looks much more continuous.
Trip to SVG
By adding some image generation to the above code, it was easy to extend it to generate an elevation profile for a trip. Here's a small tool I wrote to generate an elevation profile image for a single geojson file, and here's the result when running it on 7-fjellsturen.

Vanity Poster
The vanity poster, including ascent/descent registered inside the polygon: